
Chronic Absenteeism Rates Interactive Map
Chronic absence, defined as missing 10% or more of school days for any reason, is a proven early warning sign of academic risk for students from preschool through high school. A school’s chronic absence rate is the percentage of students who have missed that much school. Chronic absence data should inform efforts to address academic gaps from the pandemic, boost student well-being, and foster student success–whether these efforts focus on instruction, curriculum, or school climate.
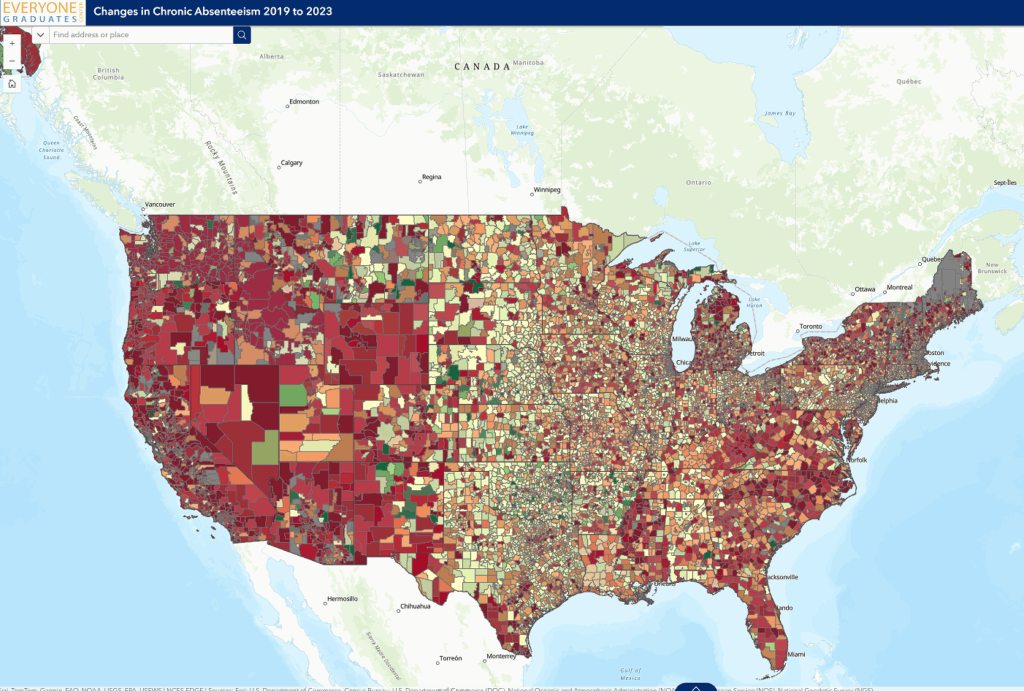
Team members at the Everyone Graduates Center has developed an interactive map tracking changes in chronic absenteeism rates from pre COVID to 2023. This tool provides a comprehensive view of the evolving trends through multiple layers, detailed legends, and intuitive navigation tools.
Download Interactive Map Instructions (PDF)
Layer Controls
- Multiple Layers: This map features several layers, each showing different time periods for chronic absenteeism rates or changes in chronic absenteeism rates over time.
- Toggle Layers: Use the sidebar on the right to turn layers on or off. All layers are visible by default. Clicking the name of the layers or the eye icon next to a layer name hides that layer, revealing the next one underneath.
- For example, if you want to view the “Chronic Absence 2022-2023” layer, you need to disable the layers above it. Specifically, turn off the “Changes in CA from Pre-COVID to 2022-2023”, and “Changes in CA from 2021-2022 to 2022-2023” layers by clicking the name of the layers or the eye icon.
- Screen Fit: Depending on the size of your screen, you might need to scroll down to see all available layers.
Navigation and Exploration
- Panning & Zooming: Use your mouse or touch gestures to pan across the map. Zoom in or out with the scroll wheel or by clicking the zoom buttons at the top left.
- Interactive Features: Click on any area or symbol on the map to view more detailed information in a pop-up window. The pop-up will show information from the top visible layer. If you want to see from another layer, you may need to turn off some of the upper layers. Check your layer settings to ensure the layer you want to explore is visible at the top.
Legends and Symbology
- Understanding the Symbols: The map includes legends that decode the symbols, colors, and classifications used to represent the data for each layer. Refer to the legends panel at the bottom right to match map symbols with their corresponding data ranges.
- View All Details: Depending on your screen size, you might need to scroll down within the legends panel to see the full list.
Additional Tools and Features
- Search & Identify: Use the search bar at the top left to locate specific addresses or places. This feature will automatically zoom in on your selected location, making it easier to focus on an area of interest.
By exploring these features and layers, you can gain a clear picture of how chronic absenteeism has evolved in different areas over time. Enjoy your exploration and feel free to use the interactive tools for a detailed dive into the data.
Download Interactive Map Instructions
Chronic absence, defined as missing 10% or more of school days for any reason, is a proven early warning sign of academic risk for students from preschool through high school. A school’s chronic absence rate is the percentage of students who have missed that much school. Chronic absence data should inform efforts to address academic gaps from the pandemic, boost student well-being, and foster student success–whether these efforts focus on instruction, curriculum, or school climate.
Chronic absence is now more widespread and more concentrated in the U.S. than ever before. It is elevated in the places where chronic absence was a challenge before the pandemic, and now is a significant challenge in many schools with little experience with large numbers of chronically absent students. When absenteeism reaches these very high levels, the educational experience all students, not just those frequently missing school, is affected. For more information, see Rising Tide of Chronic Absence Challenges Schools and All Hands on Deck .
This Map uses chronic absence data from the U.S. Department of Education for the 2018-2019 (pre-COVID year), 2021-2022, and recently released 2022-2023 school year. It highlights district-level chronic absence rates in nearly every state. Use the map to scrutinize which districts are struggling with high and extreme levels of chronic absence, and which may have identified successful efforts to keep students showing up and engaged. Read about state strategies to improve attendance in Turning Back the Tide. Please note that data is not available for Idaho and Washington in 2021-2022 school year due to inaccuracies in the federal data.
Data Map created by Everyone Graduates Center, Johns Hopkins University
SOURCE: Everyone Graduates Center and Attendance Works analysis of data from the U.S. Department of Education and U.S. Census Bureau

